A UAV-Based Multispectral and RGB Dataset for Multi-Stage Paddy Crop Monitoring in Indian Agricultural Fields (IMPaCT-UAV)
Overview
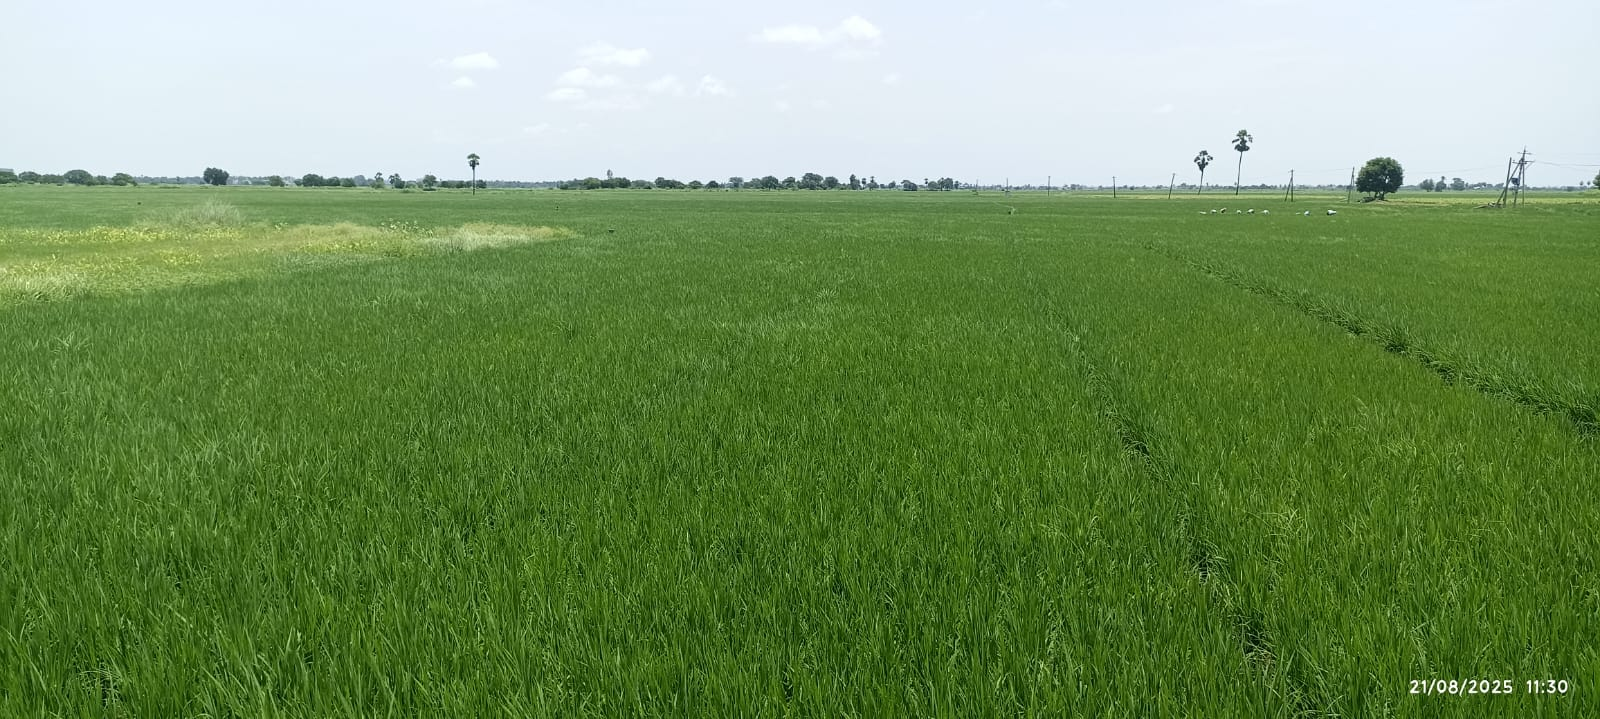
Our dataset presents a large-scale unmanned aerial vehicle (UAV)–based RGB and multispectral imaging collected over the paddy fields in the Vijayawada region, Andhra Pradesh, India. The dataset covers the complete crop growth cycle from nursery to harvest stages and was captured using a 20-megapixel RGB camera and a 5-megapixel multispectral camera equipped with four spectral bands: red, green, red-edge, and near-infrared.
It consists of 42,430 raw images (414 GB) acquired over 5 acres of agricultural land with a ground sampling distance (GSD) of approximately 1 cm/pixel. Each image is accompanied by rich metadata including GPS coordinates, flight altitude, and environmental conditions. In addition to the raw UAV imagery, the dataset repository also includes ‘Processed Images’, which contains orthomosaic, Normalized Difference Vegetation Index (NDVI) and Normalized Difference Red Edge Index (NDRE) maps; ‘Drone_Flight_Checklists’, which provides pre flight, during flight and post flight checklists; ‘Field Records’, which includes Field1 and Field2 records, weather data, and crop calendar activity records; README.txt file provides detailed instructions for dataset usage and organization.
This dataset is a valuable resource for precision agriculture research, including crop health monitoring, disease detection, targeted spraying, and yield estimation.
Study Area and Crop Details
| Attribue | Description |
|---|---|
|
Dataset |
IMPaCT-UAV |
|
Image Type |
RGB and Multispectral (Green, Red, Red-Edge and Near-Infrared) |
|
Total Images |
42,430 |
|
Dataset Size |
~414 GB |
|
Ground Sampling Distance |
1 cm/pixel |
|
Coverage Area |
5 acres (plot1: 3 acres and plot2: 2 acres) |
|
Crop |
Paddy |
|
Crop Varieties |
MTU 13/18, MTU 10/61 |
|
Season |
Kharif (2025) |
|
Location |
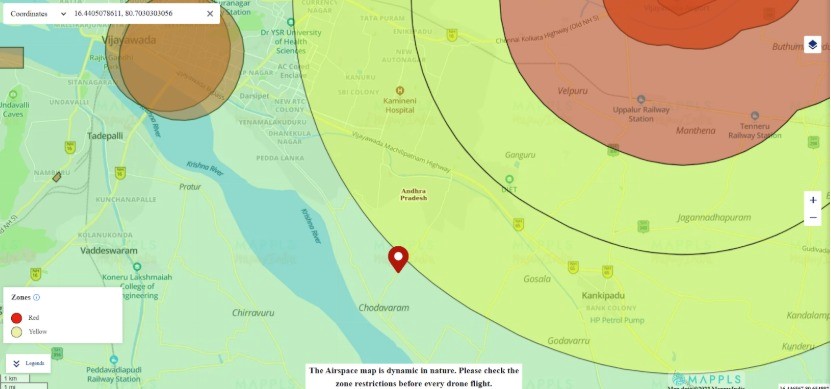
Chodavaram, Vijayawada, Krishna District, Andhra Pradesh, India |
|
Coordinates |
16° 26’ 25.8295” N, 80° 42’ 10.9091” E |
Collected Data Summary
- Plot 1 (3 acres): 25,040 images
- Plot 2 (2 acres): 17,430 images
- RGB: 8486 images
- Multispectral: 33944 images
Data Acquisition Platform
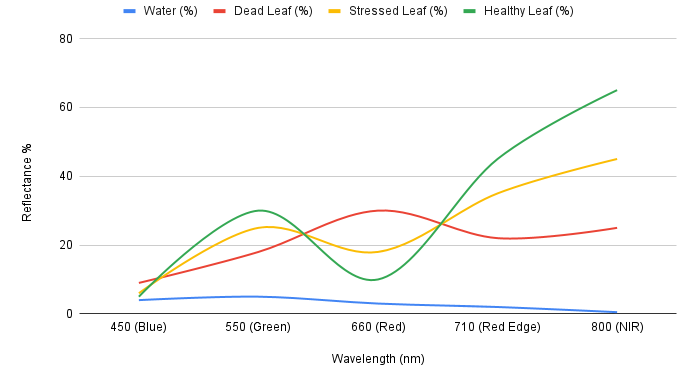
RGB images capture the visible spectrum using red, green, and blue bands, similar to human vision, and are useful for visual interpretation and crop monitoring. Multispectral images capture additional wavelength bands, including red-edge and NIR, which provide critical information about vegetation health, chlorophyll content, and crop stress through vegetation indices.
The dataset was collected using a UAV platform equipped with:
- RGB Camera: 20 MP (Red, Green, Blue)
- Multispectral Camera: 5 MP (Red, Green, Red-Edge, Near Infrared)
Image resolutions:
- RGB: 5280 × 3956
- Multispectral: 2592 × 1944
The sample UAV images of paddy crop are shown below, including RGB and multispectral bands.
- All
- Gallery Filter


Dataset Organization and Folder Structure
Root Directory
The dataset is organized under a main directory named:
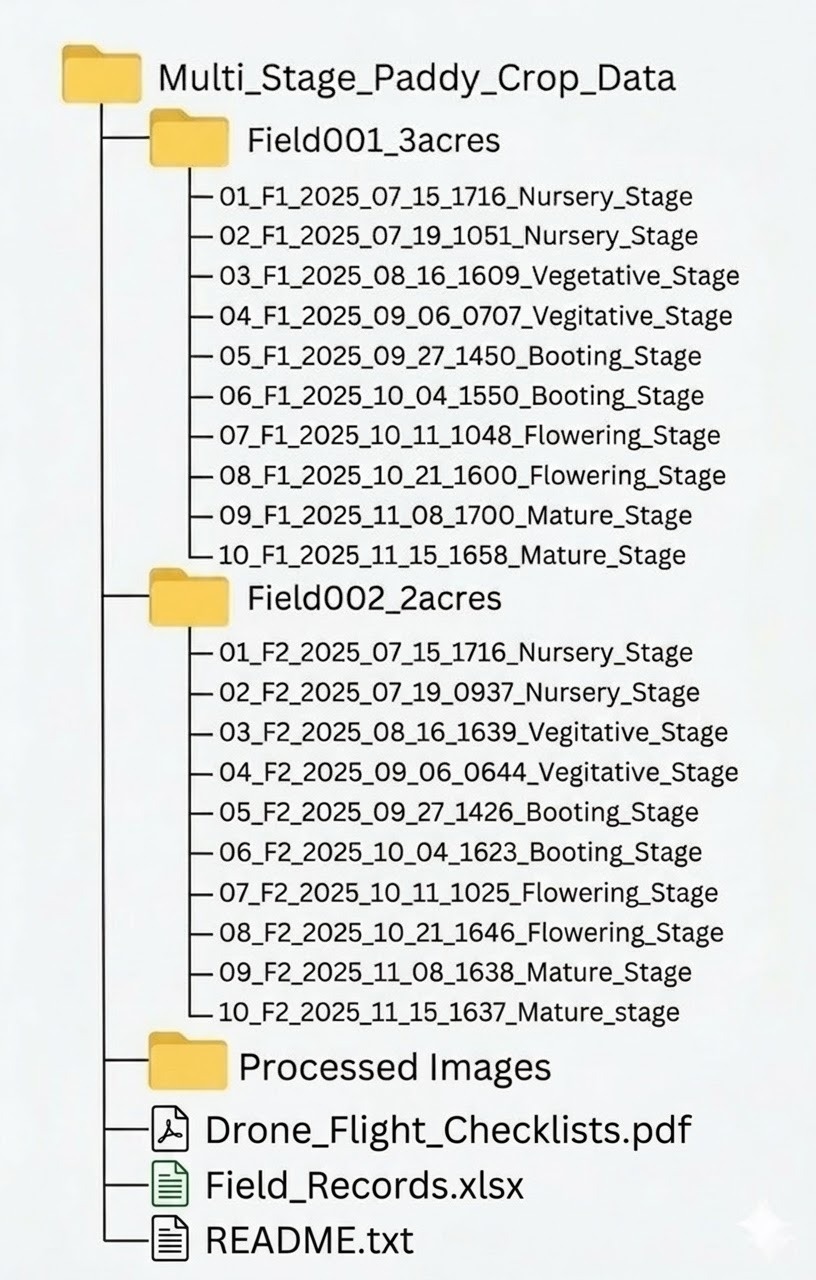
Multistage_Paddy_Crop_Data
This root folder contains raw UAV image data from two agricultural fields along with supporting documents and processed outputs.
1. Folder Naming Convention
Within each field folder, UAV data is organized into date-time folders representing individual flight missions.
Format : FX_XX_YYYY_MM_DD_HHMM_Stage
Where
- FX → Field identifier
- F1 = Field001
- F2 = Field002
- XX → Survey number
- YYYY_MM_DD → Capture date
- HHMM → Capture time
- Stage → Paddy crop growth stage
Example:
F2_03_2025_08_16_1639_Vegetative_Stage
Third survey of Field002, captured on 16 August 2025 at 16:39 during the Vegetative Stage.
2. Image Naming Convention
RGB Images
RGB images follow the format: YYYYMMDDHHMMSS_ImageNumber_D.JPG
Where
- YYYYMMDDHHMMSS → Year-Month-Date-Hours-Minutes-Seconds
- ImageNumber → Sequential image number
- D → Downward-facing RGB image
Example: 20250809173606_0001_D.JPG
This file corresponds to the first RGB image captured on August 9, 2025 at 17:36:06.
Multispectral Images
Multispectral images follow the format: YYYYMMDDHHMMSS_ImageNumber_Band.TIF
Where
- YYYYMMDDHHMMSS → Year-Month-Date-Hours-Minutes-Seconds
- ImageNumber → Sequential image number
- Band → Spectral band identifier
Spectral Bands
- MS_G → Green band
- MS_R → Red band
- MS_RE → Red Edge band
- MS_NIR → Near Infrared band
Example : 20250809173606_0001_MS_NIR.TIF
This represents the first Near Infrared image captured on August 9, 2025 at 17:36:06.
Dataset File Formats
The dataset includes multiple file formats corresponding to different data types and supporting documents.
- RGB images: JPG
- Multispectral images: TIF
- Orthomosaic, NDVI, and NDRE maps: JPEG
- Metadata files: XLSX
- Drone flight checklists: PDF
- README file: TXT
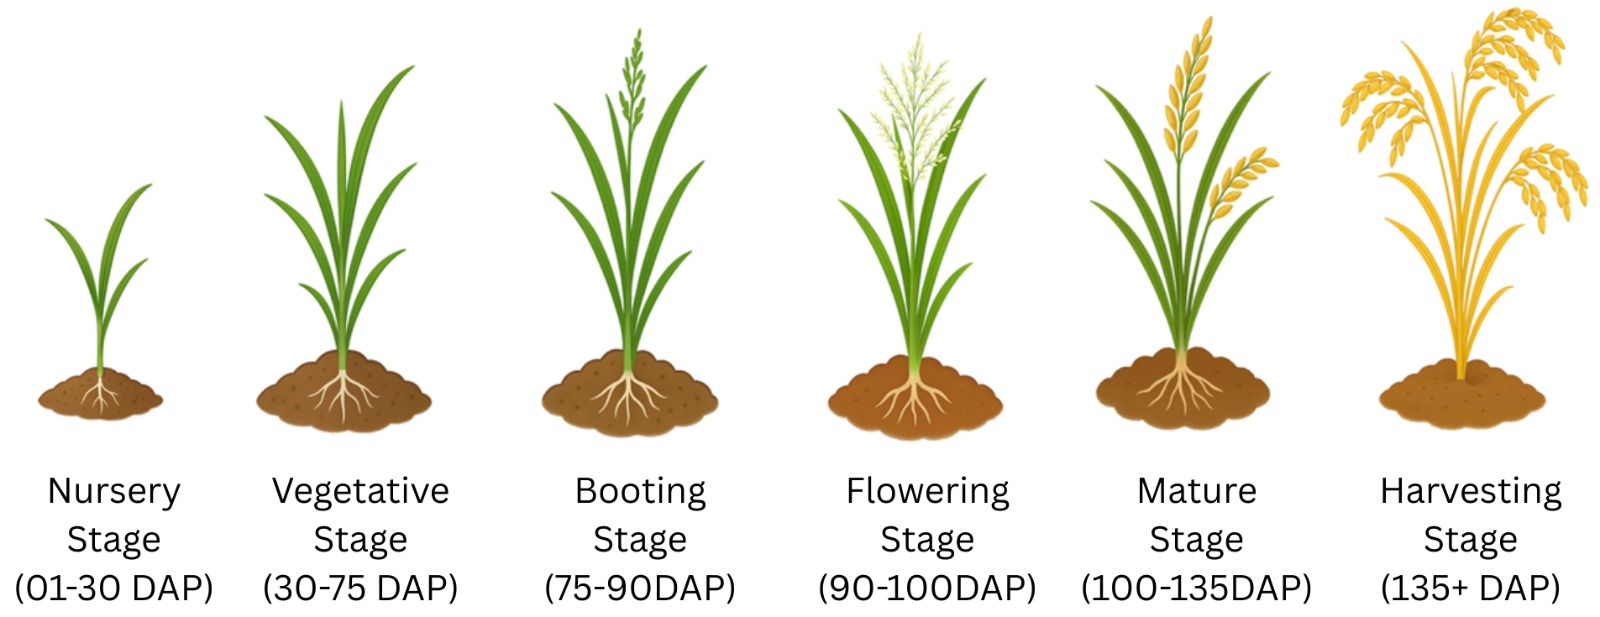
Crop Growth Stages
The dataset contains stage-wise UAV imagery covering all key paddy crop growth stages, from initial seedling establishment to full maturity, enabling comprehensive analysis of crop development and health.
| Stage | Duration | Description |
|---|---|---|
|
Nursery |
1-30 DAP |
Initial seedling establishment |
|
Vegetative |
30-75 DAP |
Rapid leaf growth and canopy formation |
|
Booting |
75-90 DAP |
Panicle formation within leaf sheath |
|
Flowering |
90-100 DAP |
Pollination and grain development |
|
Mature |
100-135 DAP |
Grain filling and leaf senescence |
|
Harvest |
post-135 DAP |
Crop reaches full maturity |
Orthomosaic and Vegetation Index Maps
Captured images were processed using Pix4D Fields to generate: Orhtomosaic , NDVI and NDRE maps.
- Orthomosaic maps – A geometrically corrected, high-resolution aerial map created by stitching multiple UAV images into a single seamless image of the entire field.
- NDVI and NDRE are vegetation indices derived from multispectral imagery that help assess crop health and growth conditions. They highlight variations in plant vigor, chlorophyll content, and early stress across agricultural fields. These maps enable large-scale crop health assessment and spatial monitoring of vegetation conditions across the agricultural fields.
Orthomosaic map of the 2 acres paddy field
NDVI map of the 2 acres paddy field
NDRE map of the 2 acres paddy filed
Applications
Our dataset, enriched with detailed metadata, enables a wide range of research and precision agriculture applications:
- Precision agriculture – optimizing farming practices using UAV imagery.
- Targeted pesticide spraying – identifying stressed or diseased areas for efficient spraying.
- Early pest and crop stress detection – monitoring subtle changes in crop health.
- Disease analysis – identifying and tracking crop diseases over time.
- Growth-stage monitoring – tracking development from nursery to harvest stages.
- Biomass and yield estimation – estimating crop productivity using image analysis.
- Vegetation index analysis – using NDVI, NDRE, and other indices to assess plant health.
- Temporal change analysis – comparing crop conditions across different growth stages.
- Machine learning for agriculture – training models for classification, prediction, and automation.
The dataset is publicly released via IEEE DataPort with a persistent DOI provided below, providing full access to both images and metadata for reproducible research.
Dataset Access
The Dataset is publicly available on:
DOI: 10.21227/475s-fq42
Research Article available on:
Hosted on: IEEE DataPort
Citation
Adari Rama Sukanya, Puvvula Roopesh Naga Sri Sai, Bodduru Neshika, Rimalapudi Sarvendranath, “A UAV-Based Multispectral and RGB Dataset for Multi-Stage Paddy Crop Monitoring”, IEEE Dataport, January 7, 2026, doi:10.21227/475s-fq42